New Horizons in Network Analysis: Machine Learning for Classification and Clustering
This is the text of my portion of a talk for the Association for Computers and the Humanities conference, co-presented with John Ladd on 25 July 2019. This post includes just the introduction and my portion of the presentation. You can find John’s portion of the talk in this post.
Introduction
In his foundational 1973 essay, “The Strength of Weak Ties,” Mark Granovetter helped to launch modern social network analysis by advocating for the ability of networks to act as a “micro/macro bridge,” a medium-scale approach that shows how small-scale occurences aggregate into large-scale phenomena. Lately I’ve become captivated by how fresh his argument still seems. Our colleagues have so far presented today on just a few of the many ways network analysis, or graph theory, can add to literary and historical knowledge by exploring medium-scale phenomena. Beginning with the first humanities network visualization projects and expanding into increased use of graph theory principles and metrics, humanities networks projects have grown up alongside the digital humanities. Though “micro” close reading approaches and “macro” statistical studies have seemed to form opposing poles of analysis, network theory has developed a strong descriptive vocabulary for medium-scale social, historical, and literary phenomena.
We now understand networks, as Granovetter did, not only as a visual aid for relational thinking but as a set of mathematical measures that can give us greater purchase on large and small questions in our field. In fact, as we will argue in today’s presentation, we have methods at our disposal today that can be combined with network metrics to great effect.
I speak of the set of statistical techniques often grouped under the umbrella of “machine learning.” In literary studies, statistical modeling—including both unsupervised clustering methods and supervised classification tasks—has most often meant processing and modeling data pertaining to words and wordcounts, but there is no reason that these same techniques can’t be applied to network metrics instead. That is to say, networks give us a great deal of measurements, and these measurements can be aggregated to allow us to sort texts in new ways.
The core of our approach is simple: network metrics can be used to create a vector, or what Ruth and Sebastian Ahnert have called a fingerprint, for an individual network or even an individual node. By calculating over all of those vectors at once, networks can be sorted into various groups. And let’s be clear: just as with modeling the words within literary texts, we learn more from the process of modeling than from the output of the model. We engage in this process to get a better sense of the set of features we’re examining, and in this case those features tell us more about networks and the systems those networks describe.
Book Review Networks
For my part of this presentation, I’m using methods similar to John’s, but I’m applying those methods to an entirely different genre of texts from a different century and different country.
My most recent scholarship builds on previous work about how hierarchies of cultural taste, in the United States and Europe especially, were established in the second half of the nineteenth century and challenged/complicated in the first half of the twentieth century, specifically book reviews.1
In what seems like a contradiction, book reviews largely moved away from sweeping remarks about what made literature good or worth reading, and focused more on summarizing and making discrete recommendations. Did book reviews stop mediating culture hierarchies, or did their approaches become more subtle? How can we best understand the roles they played?[2 These are the central concerns behind the work I’m presenting today.
I would argue that existing analysis of book reviews can be divided into three levels:
- The individual level, in which book reviews become literary studies anecdotes of a book’s success or failure
- The comparative level, in which analysis of one author is widened to include other reviews in the same periodical or other reviews of the same author
- The network level, in which we account for authors and periodicals as many among many
My work on machine learning with network features aims for level 3.3 I generated the dataset for my portion of our experiments by text-mining documents tagged as reviews from the American Periodicals Series, originally published between 1880 and 1925.4 For my network, I wanted to be able to show relationships among authors based on which periodicals reviewed them, or relationships among periodicals based on which authors they reviewed.
To convert book reviews to nodes and edges, used a combination of natural language processing and named entity recognition to tag reviews as single work reviews or multiwork reviews, and then to isolate the authors being reviewed.5
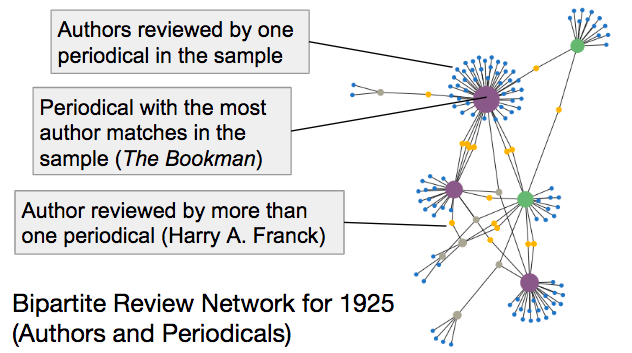
I then used these reviews as the basis for my network data. Nodes in the bipartite affiliation networks are authors and periodicals, and edges are reviews in a periodical of that author.6 In any case where an author was reviewed by a periodical more than once in a single year, I increased the edge weight between that author and the periodical (+1 for each review). I divided these data into separate networks by year.7 I used projection to create a network of authors, with the number of shared authors as edge weights, and an author network, with the number shared periodicals as edge weights.
Next, I extracted measures of each network’s overall structure, just as John described. I wanted to see if the same network traits he used could predict the date of each author-periodical network.8 As a general rule, almost all real world networks evolve over time. Borgnat et. al. summarize that “it is possible,” therefore, “to consider an evolving network as a time sequence … of networks (snapshots) and to study each of these independently.”9 Such snapshots, they argue, convert each network measure into a time series, which can be “studied using signal processing notions.”10
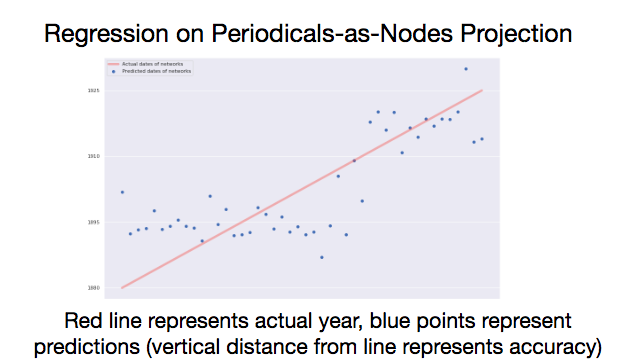
To explore the relationship of these network measures to a network’s “date signal,” I performed linear regression on my book review networks to do two things:
- evaluate overall accuracy
- discover which network measures were most predictive of a given book review network’s date
As many of you probably know, linear regression is a very well established, supervised learning approach, and it’s especially good for fitting linear data to one or more predictor variables. When many predictors are used the model can return coefficients that express the overall information value of each predictor.11 As Charles Macal has said, “we model for insights, not numbers.”12 However, in order to establish that the derive insights are meaningful, we need to establish a baseline accuracy level. The more accurate a regression model is, the more weight our insights might have. In my case, I only had 45 networks, one for each year between 1880 and 1925, so I employed a leave-one-out strategy in which all but one sample is used and the training set, and one sample is the test set. Each sample is left out once, and the model is retrained every time on the rest of the data, so you end up with 45 trials and one result per trial.13
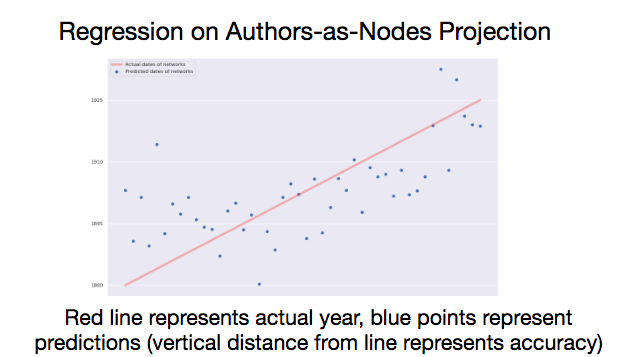
Under these conditions, the linear model was able to predict the year of networks with authors as nodes with a mean accuracy of +/- 8.16 years.
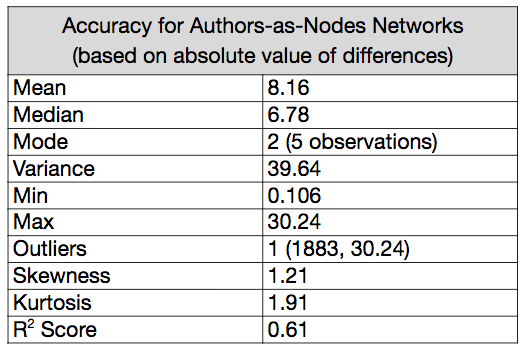
The median accuracy was +/- 6.78 years, and the mode accuracy, when predictions were rounded to their nearest integer, was +/- 2 years. The variance was 39.64, and one value (the prediction for 1883) scored as an outlier, off by 30.24 years. This outlier was unsurprisingly the worst prediction, and the closest prediction was within 0.106 years of the actual date. The r2 score for the regression without any holdouts is 0.61, where 1.0 is the maximum possible value, and a 0 would describe a model where the predictor variables provide no information.14
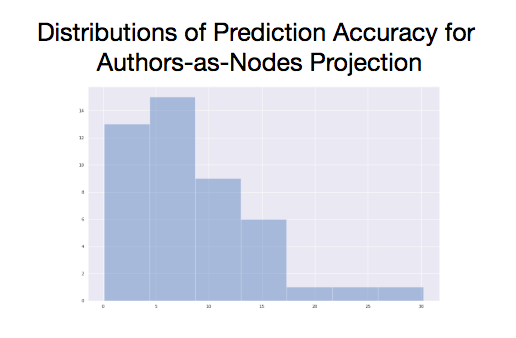
There’s much room here for improvement, but both models are performing well above the expectations of random guesses, or even if we made random guesses bounded by the date range of our data. There are outlier predictions in both models, and variance is high. That said, we are getting information about the year a network represents using only statistics that measure each network’s overall structure. At least some of our predictors tend to increase or decrease over time in predictable ways. To isolate the effect of each predictor, we can turn to the coefficients.
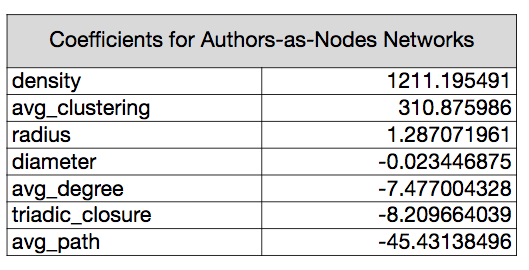
With the authors-as-nodes network, density is by far the largest positive predictor. Each time the density score increases by one point, the predicted date will increase by about 1211 years. Density in my model was expressed as a value between 0.0 and 1.0, so in reality we would see much smaller prediction increments. The next most information coefficient is average clustering, followed by average path distance, which reduces the predicted date as it increases. Average degree, triadic closure, and radius provide a small amount of predictive information, and diameter is effectively irrelevant to our model.
To generalize, author networks measured this way are becoming more dense over time. The total number of possible connections is established by the number of authors in the network, and density expresses the fraction of these possible connections that are present.
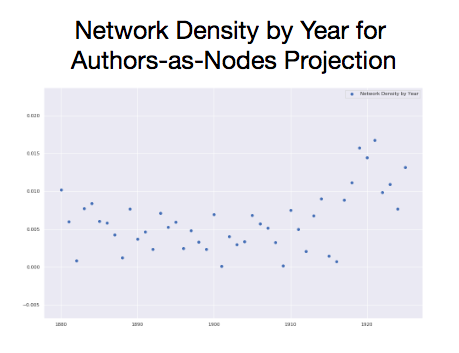
Edges represent whether two authors were reviewed by at least one periodical in common in a given year so, this means that over time, more authors share at least one periodical between them.15 At the same time, since average clustering is also increasing over time, the completeness of communities is increasing. The average node and its neighbors are more likely to form a complete graph. Meanwhile, the average path distance—or the average number of steps it takes to connect two nodes (following the shortest path between them) for all possible pairs of network nodes—is decreasing.
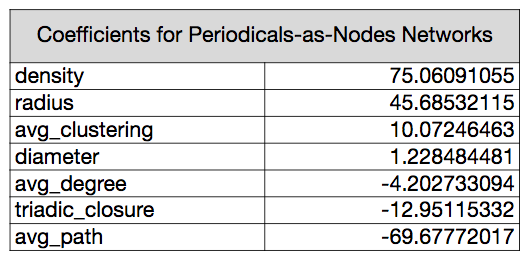
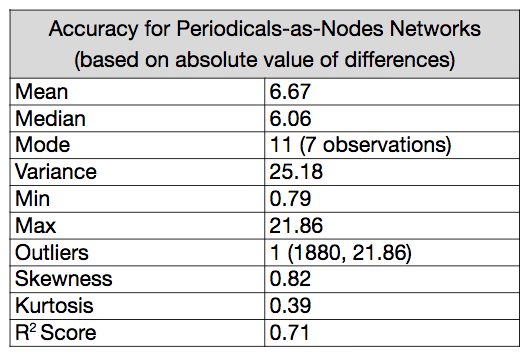
With the periodicals-as-nodes network, density remains important, but not nearly as important as it was in the first model. Average path distance is second largest coefficient, and in remains a negative predictor of date. A network’s radius is the third largest coefficient, and diameter remains the least valuable, but now, all seven network measures are at least a partial factor in the predictions.
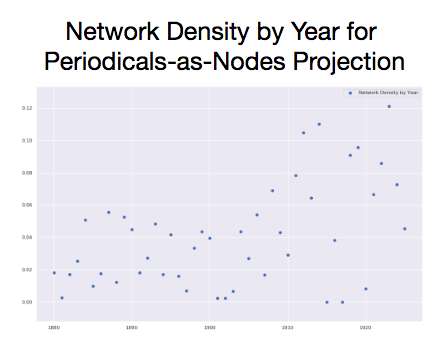
Over time, as with author networks, density is increasing. periodicals are more likely to share at least one author between them, and the average number of steps it takes to connect two nodes is decreasing. Further, as the date increases, a given periodical is marginally more likely to form a complete network with its immediate neighbors. If nodes A and B are connected and nodes B and C are connected, nodes A and C are more likely to be connected (triadic closure). Since the radius of periodical networks is also increasing over time, we can say that the network is becoming more eccentric.16
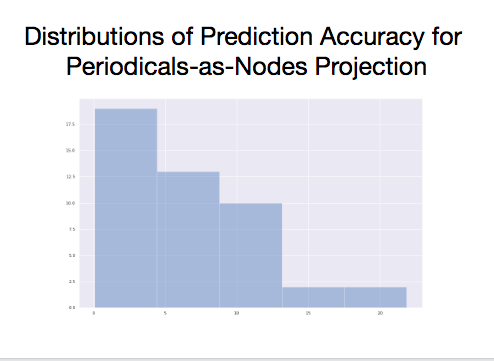
Throughout the data, there is substantial variability (or noise) foregrounding the trends (or signal), but a signal seems to be present. The structure periodicals-as-nodes networks, however, seem provide more predictive capacity than authors-as-nodes networks.
To return, then, to hierarchies of taste, this preliminary result suggests several areas for more inquiry. A more developed experiment could build on this work to address several questions. Is “who gets reviewed” consolidating over time? Or are sets of periodicals becoming more cliquish?17 Even though reviews more often summarized with light commentary, they may have shaped wider tastes. The kind of taste-making I’m talking about would be subtler than the sweeping judgements of 1870s and 1880s. Network measures could reveal such patterns, which would only be visible over time, and in the aggregate.
Conclusion
In this presentation, our goal was to demonstrate that machine learning methods like clustering and classification can be applied to measures of entire networks, and to gain insights about nodes in a network. For our examples, we deliberately chose networks represents different types of texts, different times periods, and different geographies. We have demonstrated some of the potential payoffs of applying machine learning methods to networks, with carefully considered network measures as our feature sets. Thereʼs much more to be done with these methods. Potential next steps for our work include:
- Refining network inference methods by experimenting with how networks are constructed, and how stable our networks are (i.e., how much do they vary depending on how we generate them)
- Establishing confidence scores for each inferred node our networks
- Experimenting with expressing unscaled network measures as z-scores
- Assessing the impact of incomplete networks on the predictor data
- Encoding node attributes like age, gender, country of origin, book publisher, price (or using these data points as nodes)
- Predicting other categories (monthlies vs weeklies; playwright gender) using similar methods
- Using more sophisticated machine learning methods (deep learning)
- Combining network features with metadata, term frequencies, etc. to inform predictions
- The very insightful suggestions you are going to give us during Q&A
Endnotes
- This period also saw massive changes in how newspapers and magazines participated in the mediation of cultural rules and boundaries. Book reviews are especially salient dimension of cultural gatekeeping, as a sea change in review culture took place at the turn of the 20th century. See James F. English, The Economy of Prestige: Prizes, Awards, and the Circulation of Cultural Value (Cambridge: Harvard University Press, 2008); Lawrence W. Levine, Highbrow/Lowbrow: The Emergence of Cultural Hierarchy in America (Harvard University Press, 1988); Janice A. Radway, A Feeling for Books: The Book-of-the-Month Club, Literary Taste, and Middle-Class Desire (University of North Carolina Press, 1997); Joan Shelley Rubin, The Making of Middlebrow Culture (University of North Carolina Press, 1992).
- How can we, by extension, better understand how periodicals mediated cultural hierarchies, and how such mediations changed over time?
- This third level is inaccessible to traditional book historians and literary studies scholars, as it requires describing the relationships among thousands of periodicals and tens of thousands of authors. Further, it raises questions of how these networks changed over time, and how we can account for macro-level shifts while controlling for the constant entry and exit of particular network participants.
- I have a licensing agreement with Proquest that allows me to work with 11.5 million digital objects from 1,887 periodicals, with about 300,000 objects pre-tagged as reviews.
- I used metadata from the HTRCʼs fiction volumes included in its “Word Frequencies in English-Language Literature, 1700-1922” dataset. I also used author and title pairs from the in-progress 1922-present counterpart. I did an initial pass on the book reviews to separate single-work reviews from reviews of multiples works using a combination of regular expressions and Named Entity Recognition. I then isolated the most frequently mentioned author surname in single work reviews, and finally matched the most frequently mentioned author forename to disambiguate authors with the same last name. My initial goal was to use title-author pairs, along with publication dates, to isolate contemporaneous book reviews mentioning the author-title combination, which would minimize the chances of tracing minor mentions of authors in reviews and maximizes the chances of isolating substantive book reviews of those particular works. However, the data I ended up using is not yet title-specific. My blog has several posts about this ongoing work.
- Any reviews that didnʼt match forename-lastname pair in m dataset were excluded from the networks I generated.
- i.e., with each network representing a one-year snapshot of relationships among many periodicals.
- I hypothesized that at least some of the traits of the network were changing over time in a linear way; that is, progressing from one type of network to another type. As John did, I converted each raw measure to an expression of “distance from the mean” to control for different network sizes. The mean was established by generating 50 random graphs of the same size and a similar structure.
- Borgnat, Pierre, et. al. “Evolving Networks,” In Mining Massive Data Sets for Security: Advances in Data Mining, Search, Social Networks and Text Mining, and Their Applications to Security, edited by Françoise Fogelman-Soulié (IOS Press, 2008): 198.
- Ibid.
- When many predictors are used the model can return coefficients that express the overall information value of each predictor (i.e., multiple regression)
- Macal, Charles M. “Model verification and validation.” Workshop on Threat Anticipation: Social Science Methods and Models. 2005.
- For a summary of leave-p-out validation, see Prashant Gupta, “Cross-Validation in Machine Learning - Towards Data Science,” Medium, June 5, 2017, https://towardsdatascience.com/cross-validation-in-machine-learning-72924a69872f.
- The r score an also be negative; for example, if the mean value of the predictors provides a better prediction than the model. See https://scikitlearn.org/stable/modules/model_evaluation.html#r2-score
- These snapshots are inferred networks based on a predetermined list of authors so, for this to be true, overlap of who-is-reviewed in the underlying population is likely increasing as well.
- Each nodeʼs eccentricity is said to be the maximum distance to another node in the graph. Radius is a measure of the smallest of these maximums
- Is homophily is changing over time (along genre lines, by periodical type, by author gender, etc.)? Are there patterns to authors garnering single-work reviews vs. multiwork reviews?